Monitor and Improve Your MCP & AI Ecosystem
You can’t optimize or fix what you can’t see.
Explore MCP Manager by Usercentrics’ observability features.
Enterprise-Grade Observability To Navigate the AI Frontier
End-to-End, Traceable MCP Logging
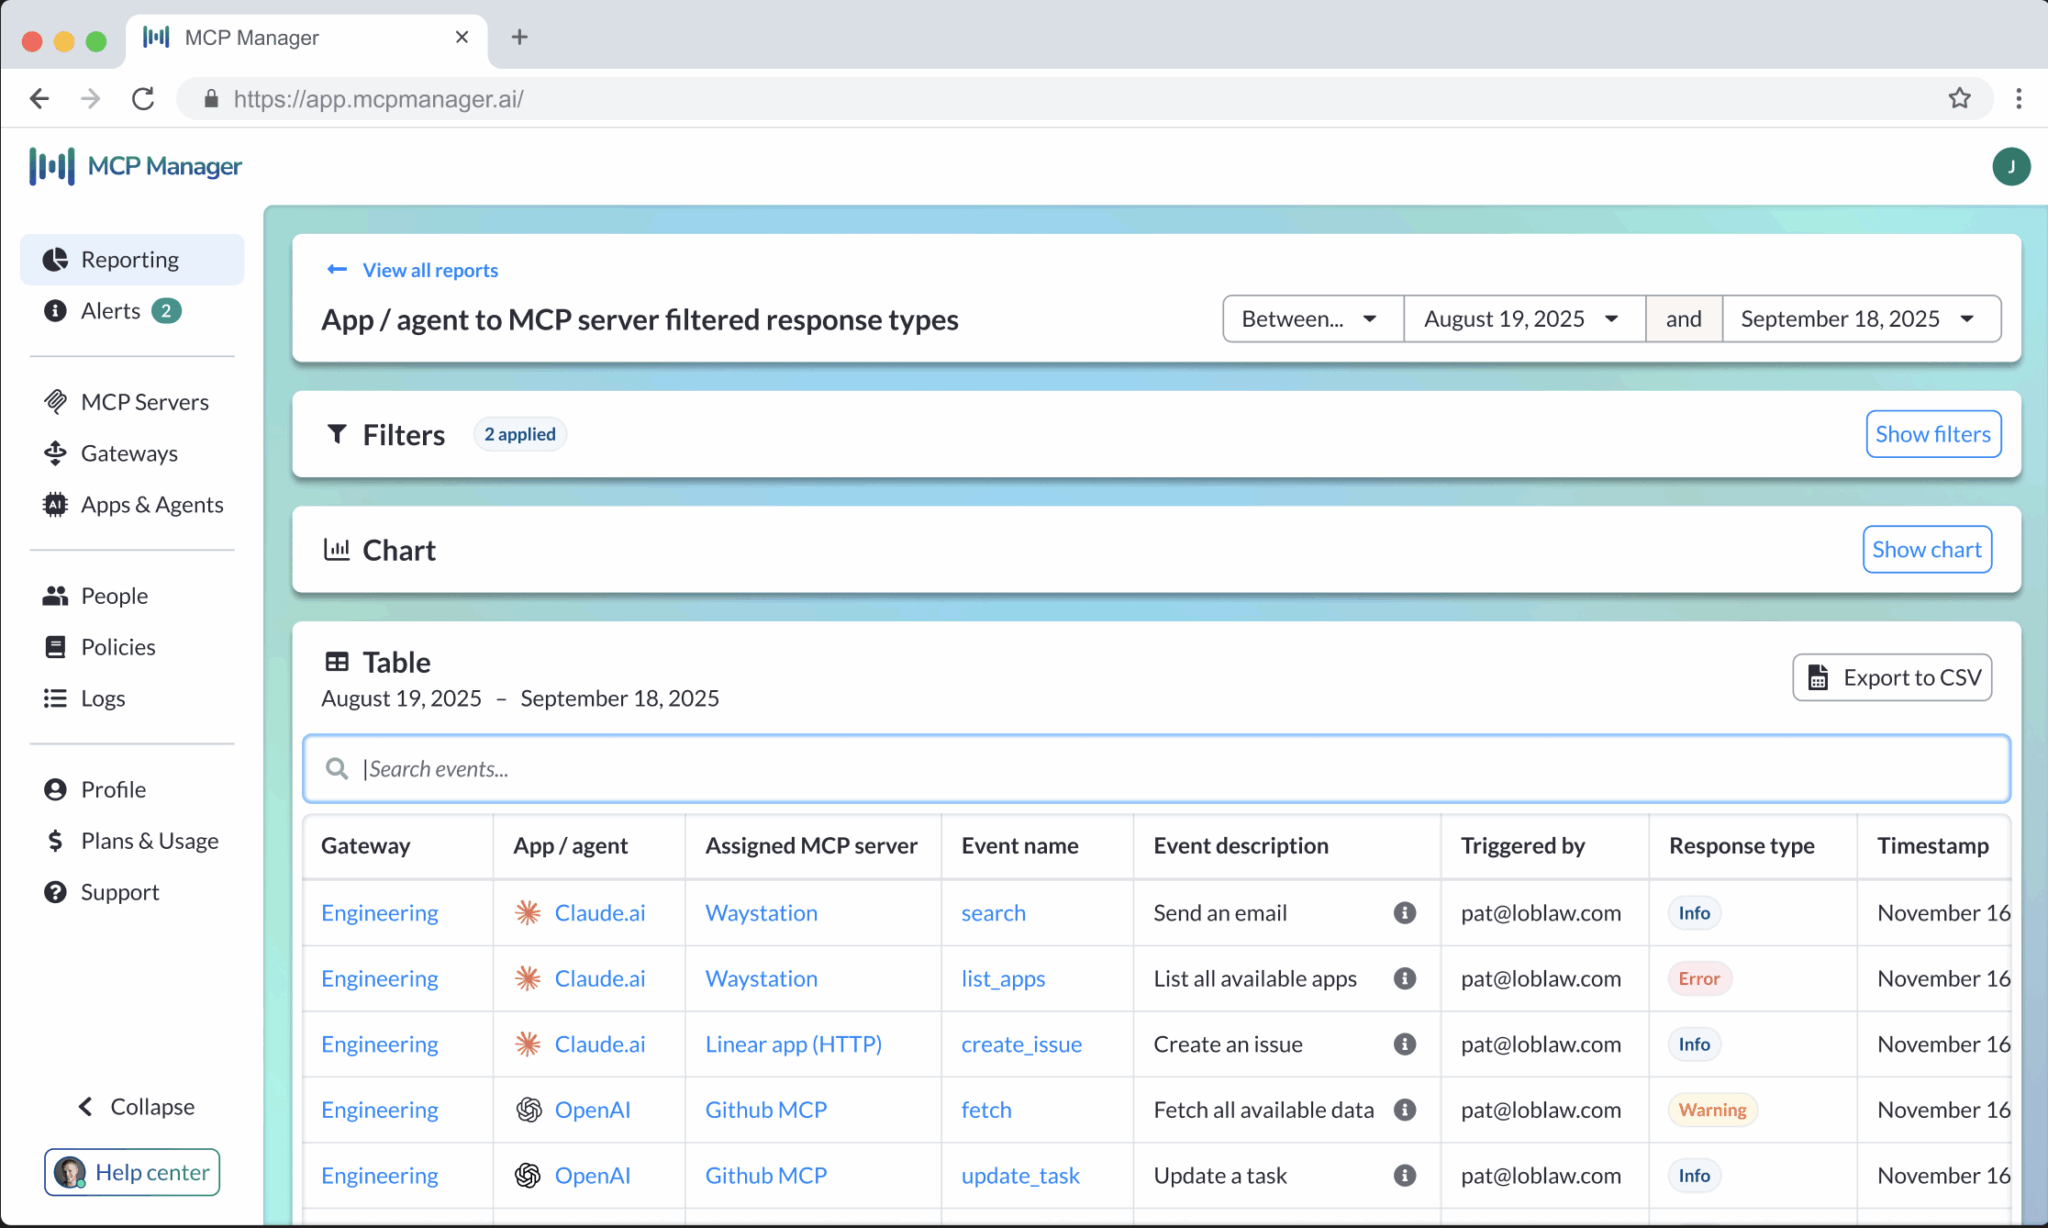
Most MCP logs only work for basic debugging. The rich logs in MCP Manager by Usercentrics provide contextual metadata to power reports, dashboards, and alerting, allowing you to conduct detailed auditing and investigations.
Measure & Demonstrate ROI
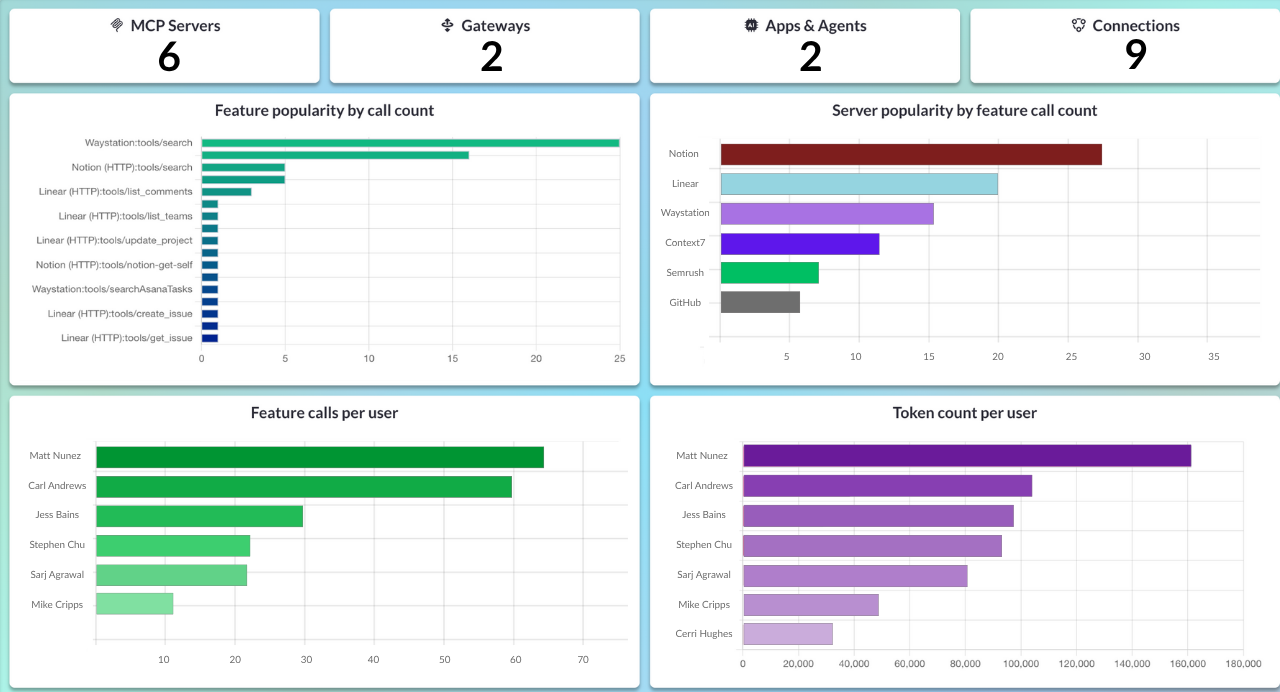
Validate and optimize your AI investment with real-time dashboards. Get insights that shape and support your AI initiatives. Understand where AI utilization is highest, where resources are most in demand, and where your attention is needed to improve AI agent performance.
Get a Pulse on Uptime, Runtime, and MCP Usage
Be the first to know if any MCP servers experience issues or stop working. Gain insight into what servers your team is using. MCP Manager by Usercentrics fills the observability gaps inherent in Model Context Protocol.
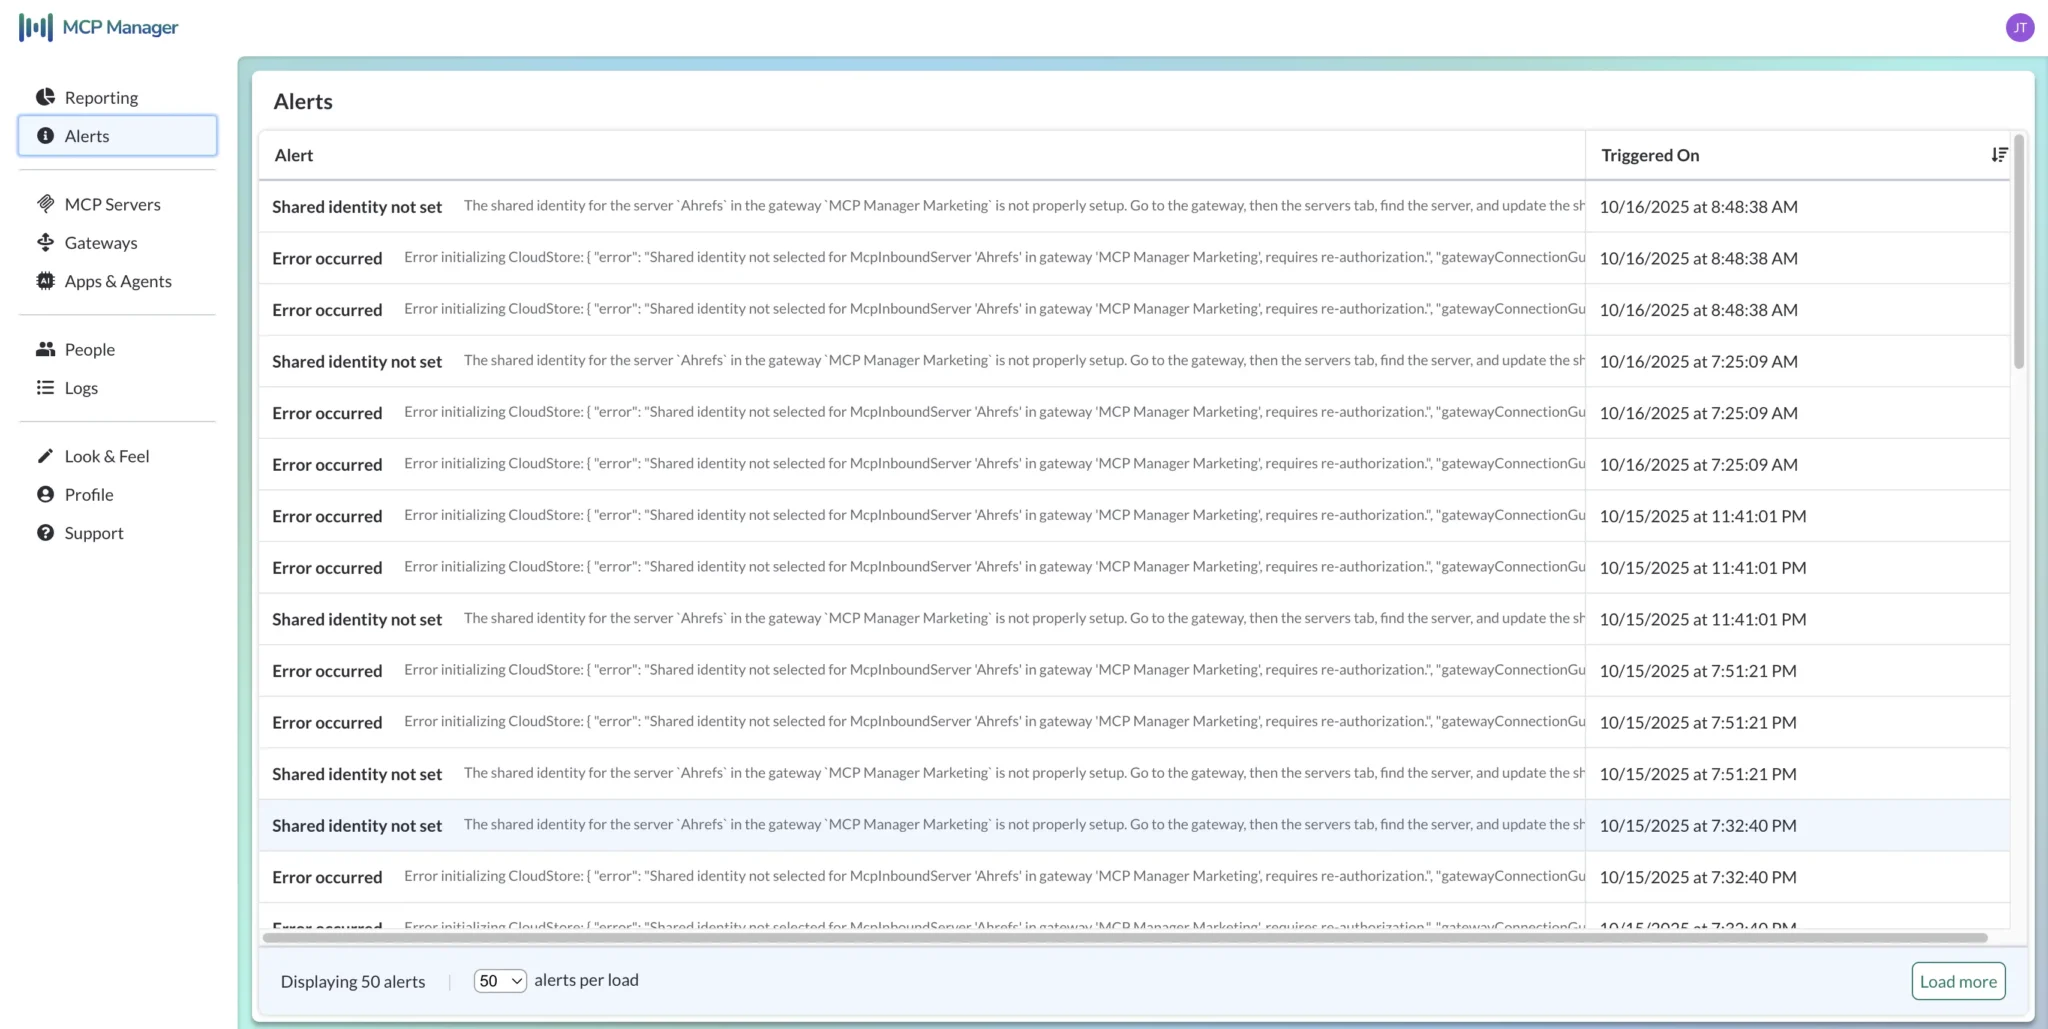
Stay Secure and Stable With Alerts
Maintain the health and high-performance of your MCP ecosystem with fine-tuned alerts for security, resource, and uptime issues. Ensure rapid response times to any incident.
MCP Observability FAQs
What is MCP observability?
MCP observability refers to logging, monitoring, and analytics capabilities for communications and traffic using the Model Context Protocol, primarily between MCP clients and MCP servers.
MCP observability can also refer to the ability to oversee and analyze MCP activity, which those logging, monitoring, and analytics capabilities collectively provide.
What are the main components of MCP observability?
The main components of MCP observability, which all organizations should implement, are:
- End-to-end, logging of all MCP traffic that is traceable across different MCP servers (i.e., logged events must include a Trace ID, Correlation ID, or similar)
- Real-time, triggered alerts for key issues in MCP connectivity, performance, and security.
- Reports and dashboards showing key indicators of MCP performance, health, and security, using real-time data
Why is MCP observability essential?
MCP observability is essential for organizations adopting AI and MCP servers, as it provides them with real-time insights into the interactions between LLMs/AI agents and applications, data, systems, and other resources.
Organizations can use these insights to:
- Monitor and measure the performance and reliability of MCP servers and MCP connections
- Track and troubleshoot performance or security issues across multiple MCP servers and sessions
- Monitor the MCP server and tool usage to evaluate adoption, impact, and remove unused servers
- Identify and address performance bottlenecks
- Identify and mitigate security risks, and respond more quickly to incidents
- Conduct detailed investigations to determine root causes of performance or security issues
- Measure token usage and other costs
Some platforms, such as MCP Manager by Usercentrics, also provide alerts as part of their MCP observability functionality, enabling teams to respond more quickly to high-priority performance, connectivity, or security issues.
Without MCP, observability organizations have little to no visibility over MCP traffic, security, and performance. This leaves them unable to monitor and improve the performance, security, and business impact of their MCP ecosystem.
What observability features does MCP Manager by Usercentrics offer?
MCP Manager by Usercentrics currently offers the following observability features:
- End-to-End Logging: Fully traceable, verbose logging of all MCP communications, including plentiful metadata for reporting, audits/investigations, and alerting to observe performance, utilization, and security. You can view logs within our platform, export them, or pass them to integrated observability platforms.
- Real-Time Alerts: Configurable alerts that enable you to preserve and improve the health of your MCP ecosystem, including alerts for connection errors, security issues, underperformance, and more.
- Comprehensive Reporting: Customizable, easy-to-use reports and dashboards with real-time data that empower you to monitor and improve various aspects of your organization’s AI and MCP ecosystem, including security, performance, usage, and resource utilization.
Are observability features built into the MCP Manager by Usercentrics platform?
Yes, the following observability features are all built into our platform:
- End-to-end logging
- Real-time alerts
- Comprehensive reporting with dashboards
Can I export logs, reports, and other data from MCP Manager by Usercentrics?
Yes, if you have the required permissions, you can export your organization’s logs, reports, alert records, and other data from MCP Manager by Usercentrics. Exporting data from our platform provides you with the ability to combine your data of MCP traffic with complementary data from other sources, or to share in organizational reporting platforms and BI tools.
How does MCP observability help organizations improve agent performance?
MCP observability provides unified, detailed, end-to-end insights into the complex, chained workflows that AI agents operate to complete tasks and goals, including tool calling, context reasoning, and memory updates.
Teams responsible for AI adoption and optimization can use these insights to identify, understand, and address bottlenecks and failures in AI agents’ workflows.
These teams can also identify areas of high-token usage and take measures to optimize these high-expenditure workflows, split them across multi-agent teams, or offload burdensome, token-consuming activities to secondary assistant LLMs or an intermediary MCP gateway.
What are some of the most popular report types in MCP Manager by Usercentrics?
The most popular reports among MCP Manager by Usercentrics customers include:
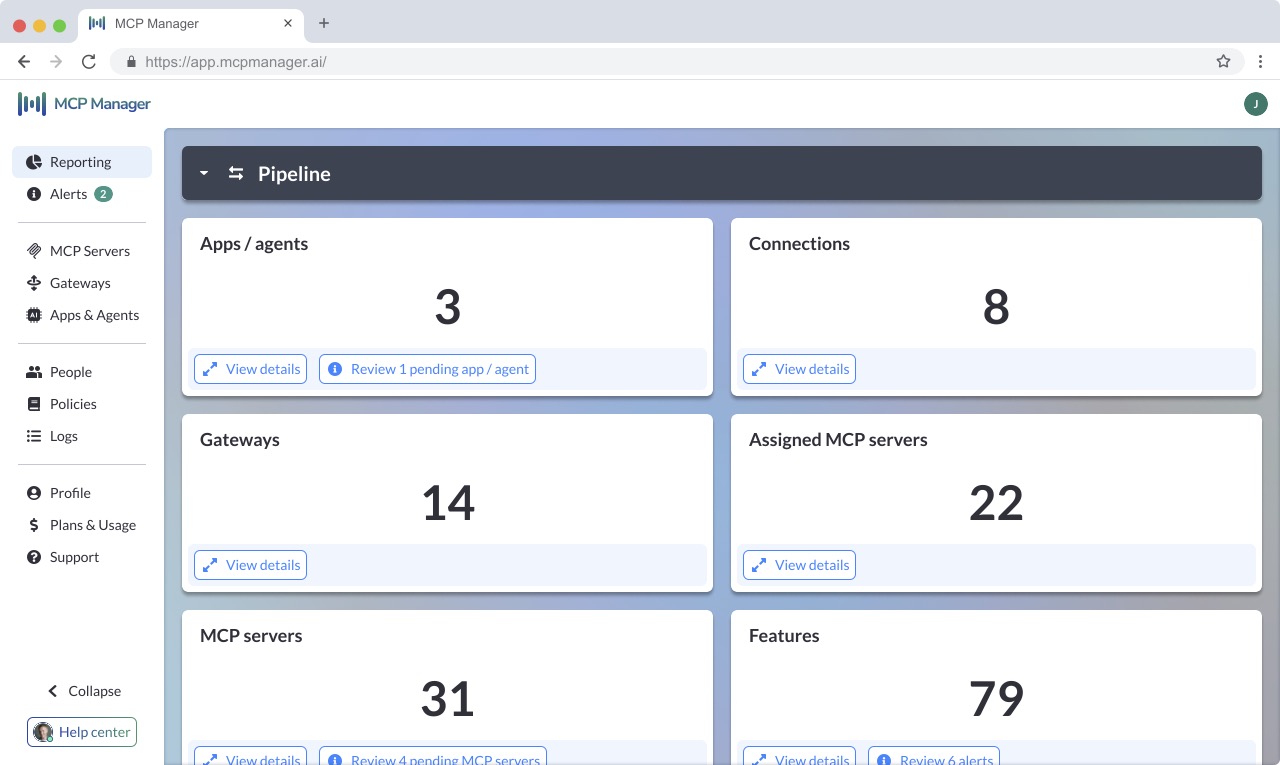
- Total number of active servers
- Total number of active gateways
- Total number of active apps and agents
- Total number of connections
- Feature calls per user
- Token count per user
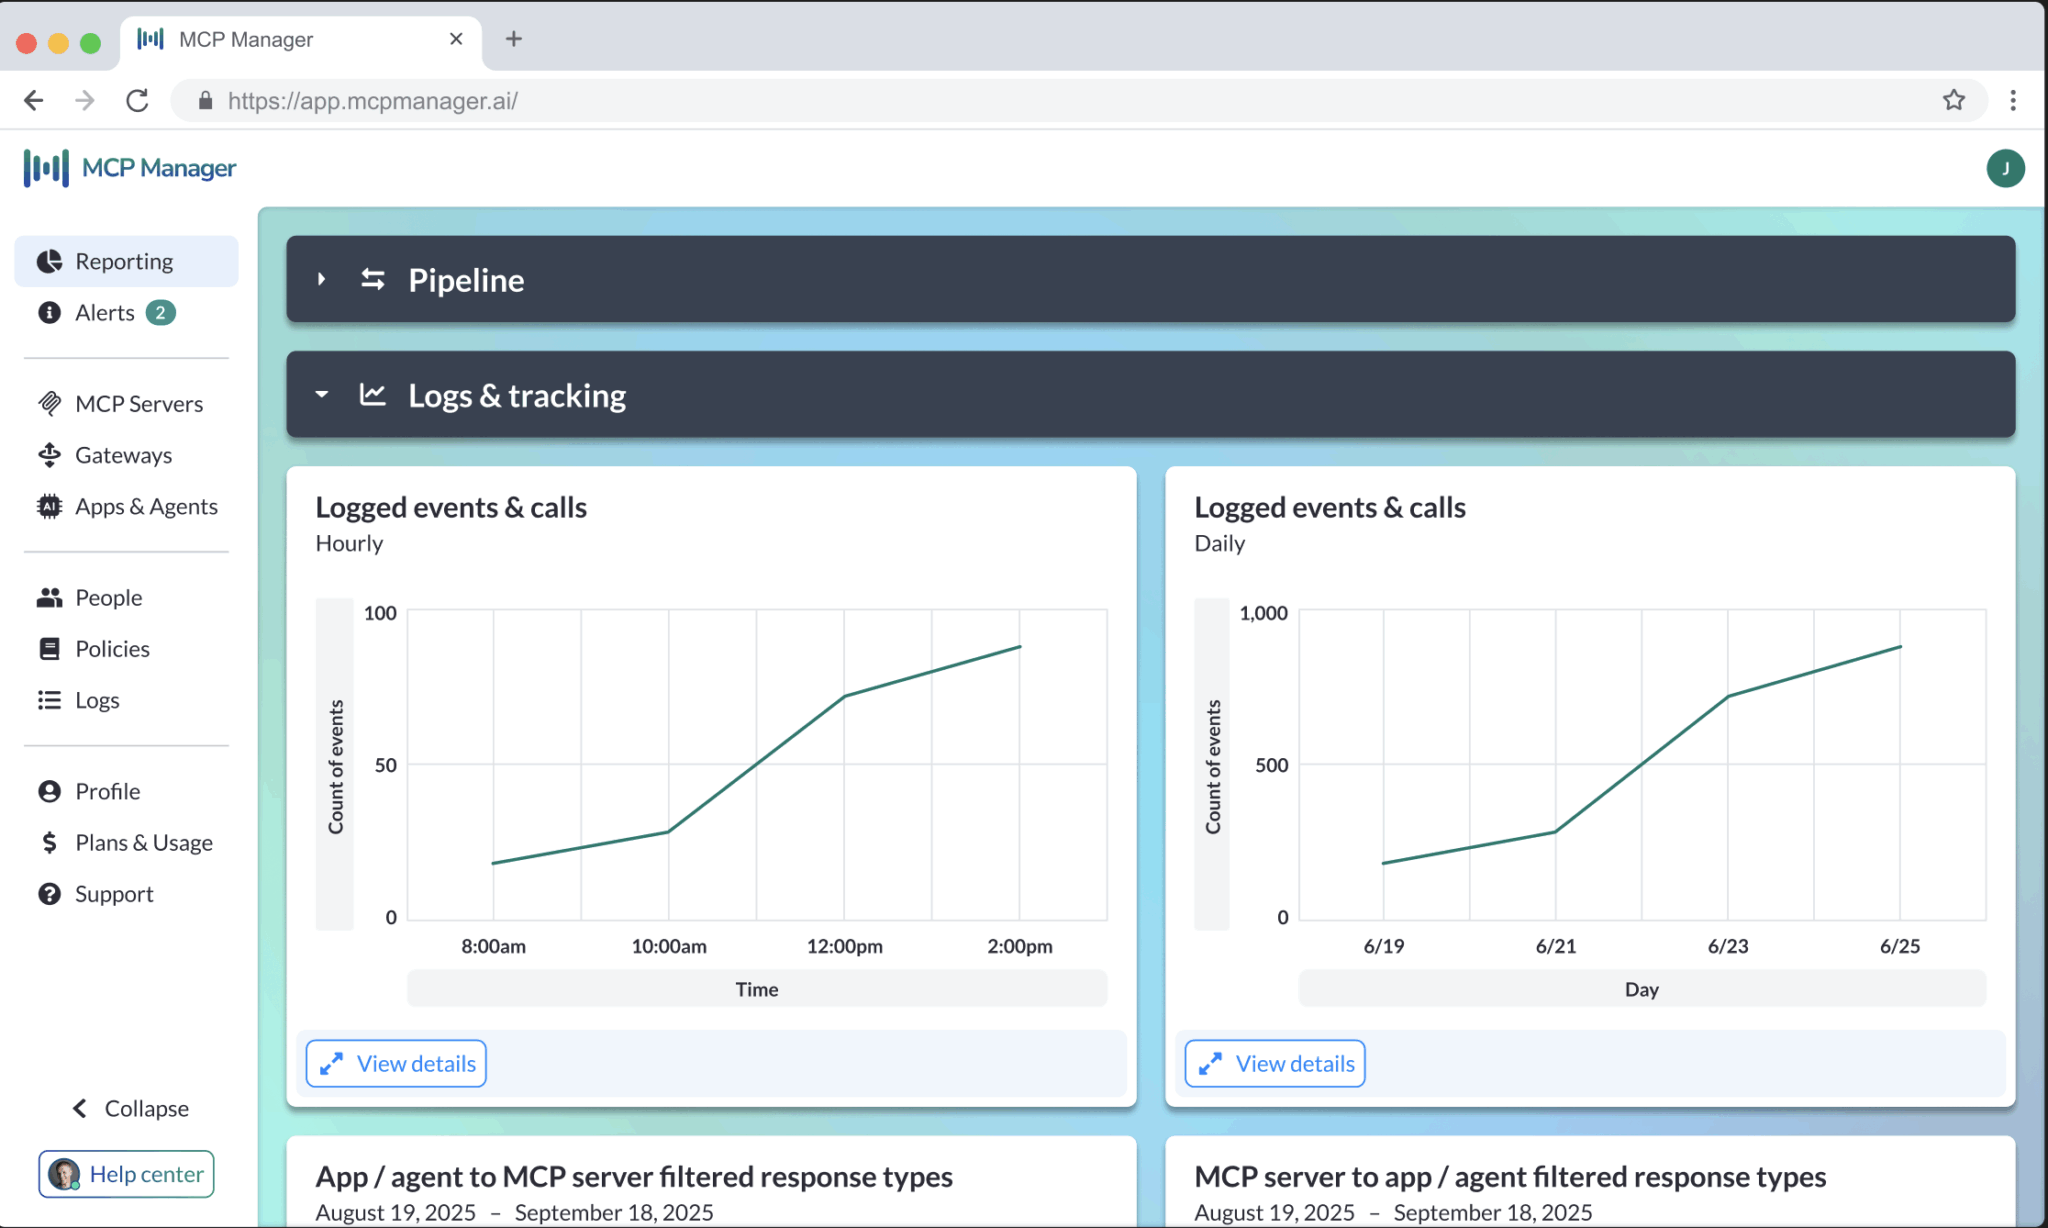
- Feature calls over time
- Token count (token usage) over time
- 95th percentile duration of feature calls
- Median duration of feature calls
- Server popularity by user count
- Number (and error type) of error codes by MCP server