Mastering MCP Observability: Why It’s Essential and How To Achieve It

MCP observability refers to your ability to see, monitor, and analyze real-time information about your organization’s Model Context Protocol (MCP) ecosystem.
You can use MCP observability to track and analyze your MCP deployments’ performance, connectivity, security, usage, and other attributes. Observability is important to your organization’s ability to use MCP servers at scale securely and reliably.
Observability is an essential ingredient in making MCP server and AI deployments manageable, measurable, and improvable, particularly for enterprise use of MCP servers.
Without observability, you have no idea how your MCP deployments are performing (or to some extent, whether they are working at all). Your response to issues is slower, and your ability to identify fixes and improvement opportunities is severely constrained.
The good news is that MCP observability is already available through MCP management tools like MCP Manager, which provides easy, managed MCP deployments, a centralized MCP management platform, a secure gateway for all your MCPs, and comprehensive MCP observability with end-to-end logging, real-time reports and dashboards, and alerting.
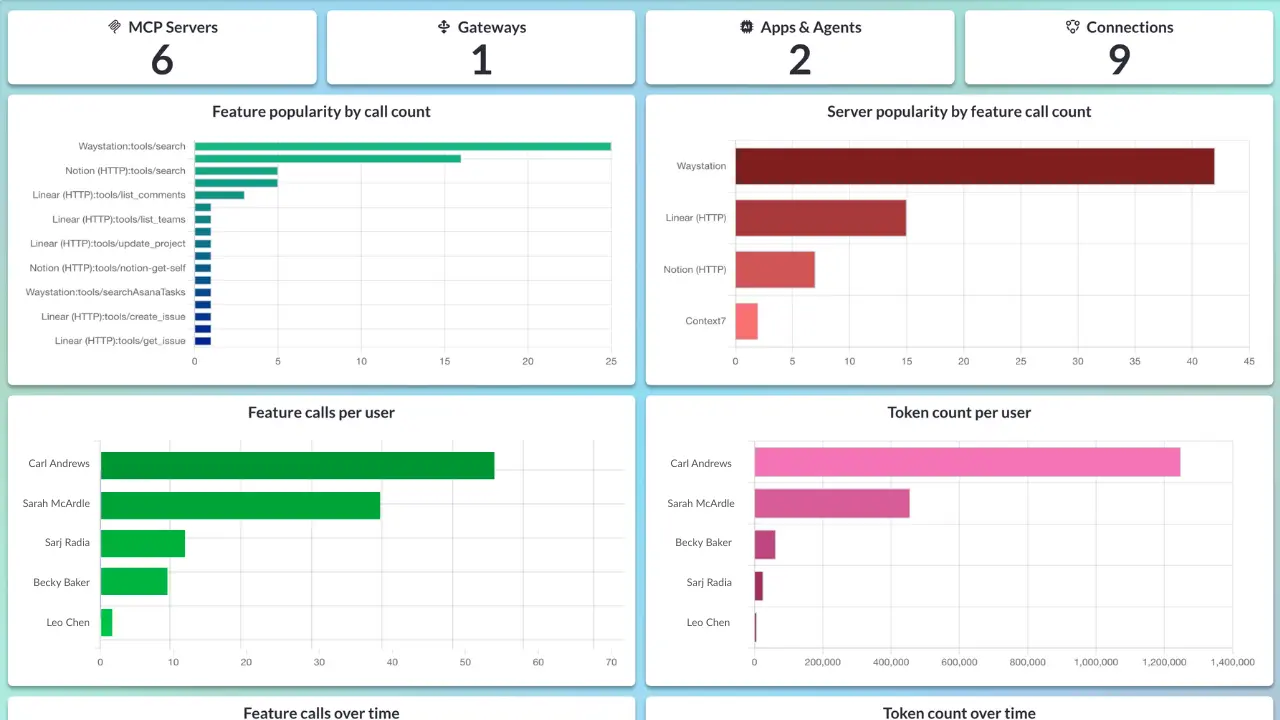
Example of a dashboard for MCP observability in MCP Manager:
Read this article to learn what MCP observability is, why it’s essential, the key components that make up MCP observability, and the different tools you can use to deliver it.
MCP Observability Webinar – Watch Now To Learn More About MCP Observability
Watch this fast-track session that will provide you with everything you need to know about MCP observability.
Your knowledgeable host is Mike Yaroshefsky, MCP Manager founder, CEO, and guru on all things AI and MCP. In the webinar, you will learn:
- The key ingredients of MCP observability
- Why MCP observability is essential
- How to use MCP observability to improve your MCP ecosystem’s security, performance, and ROI
Watch Here
Complete this form to unlock the recording:

What is MCP Observability?
MCP observability refers to the ability to monitor and analyze various attributes of your organization’s Model Context Protocol (MCP) traffic, communications between MCP clients and MCP servers, or events that occur within the MCP clients and servers themselves.
MCP observability enables teams and organizations to monitor, manage, and improve the health, performance, efficiency, and security of their MCP ecosystems.
The attributes that organizations typically monitor and analyze as part of MCP observability include:
- Performance: Monitoring of latency, error rates and types, tool call duration, resource utilization by servers and/or users, and connectivity health.
- Usage: Monitoring of Server and tool popularity, tool and token usage by user and/or server, and other metrics to track MCP server usage by users, agents, or teams.
- Security: Monitoring of security policy enforcement, “shadow” MCP detection, invalid access attempts, prompt sanitization, and other security red and orange flag events, or near-misses.
The three main components of MCP observability are logging, dashboards, reports, and alerting.
Organizations typically get their logs, dashboards, and alerts for MCP traffic from specialized MCP middleware (such as MCP Manager) with MCP observability features.
If required, organizations can also add data from other sources into their MCP manager platform or integrate it with general observability platforms.
Why MCP Observability is Essential
MCP observability is essential to successfully deploying and using MCP servers at scale. MCP observability transforms the complex, typically unseen interactions between MCP clients, servers, and other participants into information that you can use to:
- Drive a range of processes
- Trigger alerts for performance and security issues
- Conduct detailed audits and investigations
- Understand and improve your MCP ecosystem’s performance, security, utilization, and overall health
- Improve AI agent efficiency and effectiveness
- Demonstrate and improve the positive impact of your AI and MCP deployments
You cannot fix what you cannot see.
Without MCP observability, it is impossible to pinpoint the root causes of issues in security, connectivity, or performance. You cannot understand how agents and users interact with MCP servers or how to optimize their multi-step, chained workflows.
In addition, MCP observability enables you to evaluate the performance and ROI of your AI and MCP deployments, and to demonstrate this to stakeholders and the organization as a whole.
What are the main components of MCP observability?
The main components of MCP observability are:
- Logging
- Reporting
- Alerting
Below is a more detailed explanation of each component and the requirements it needs to provide robust observability for businesses and other organizations.
MCP Observability Component #1: Logging
MCP logging is the foundational component of MCP observability. Your logs of MCP traffic and events provide the data used to populate your reports and dashboards and to trigger your alerts.
MCP logs within MCP Managers built-in logging module:
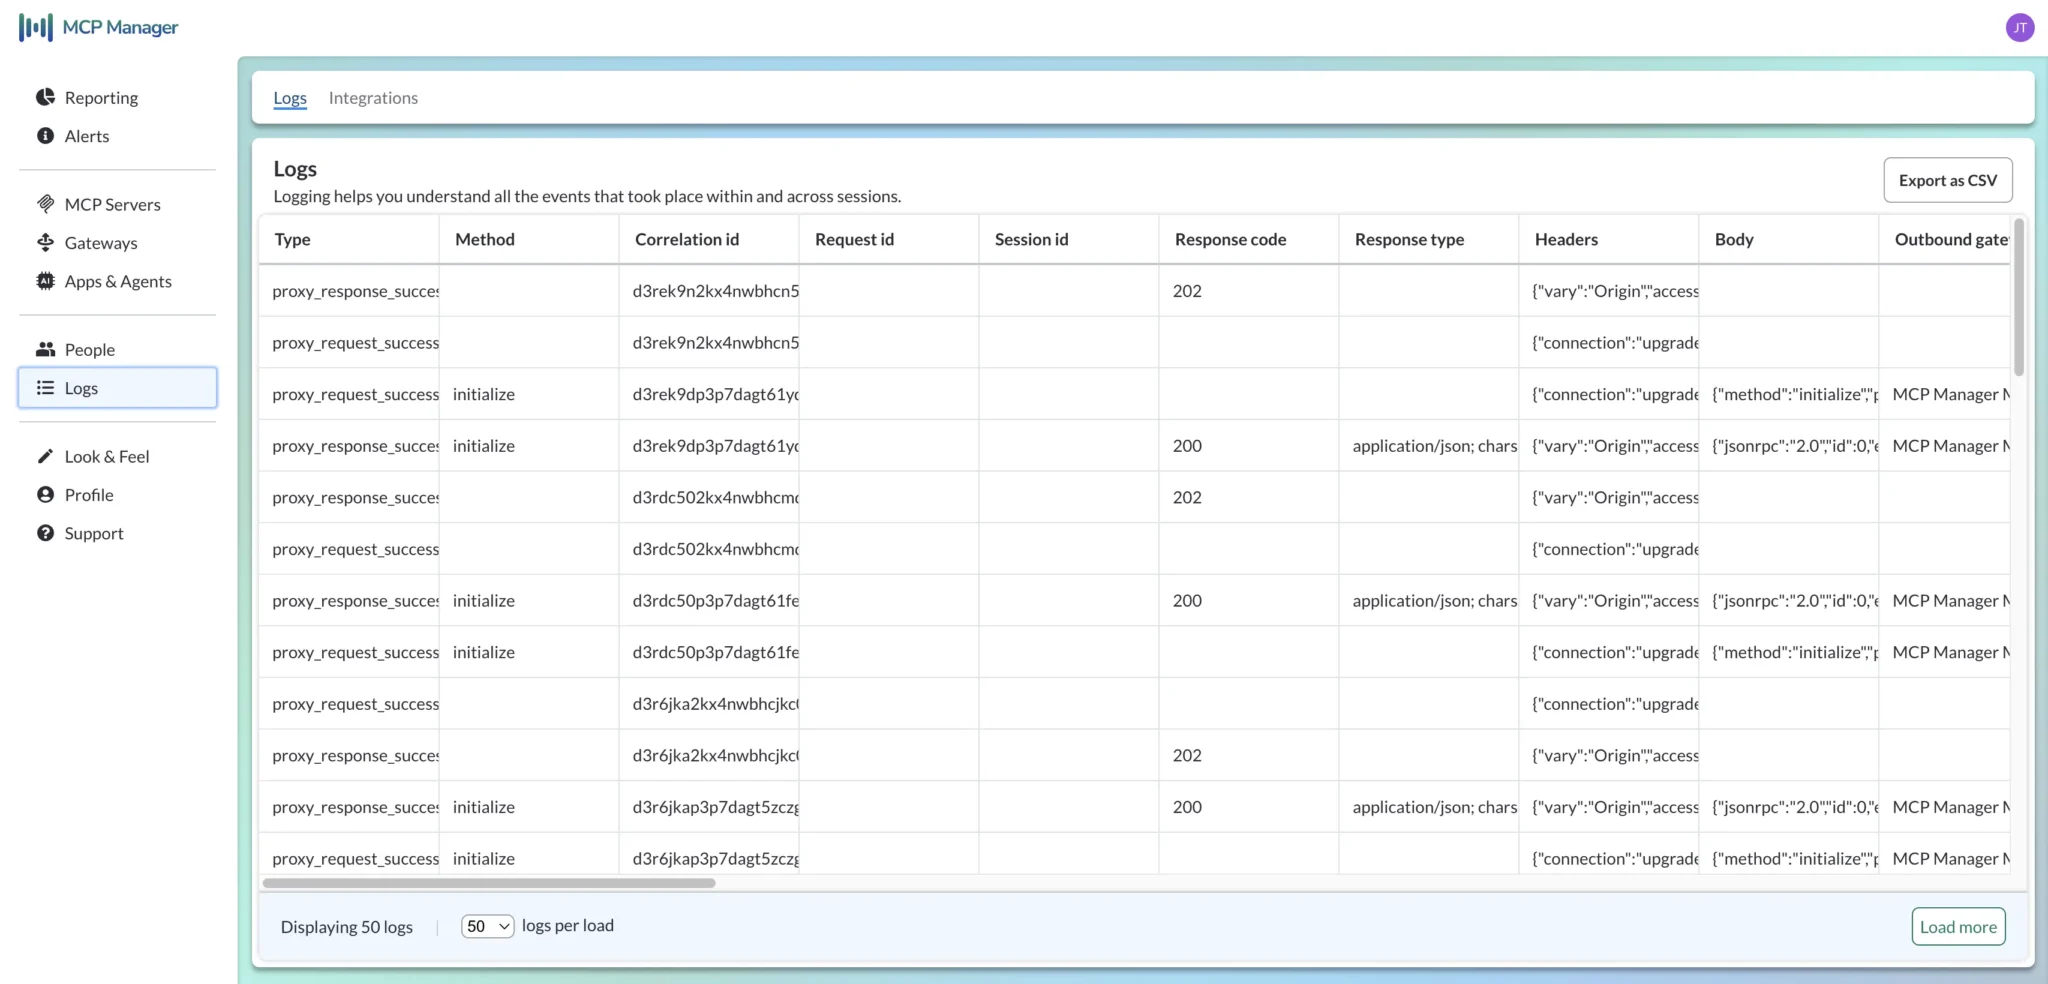
To carry out audits, populate reports, fire alerts, and generally achieve a basic level of MCP observability, you need MCP logs that are:
- Retrievable: You can access logs for sessions outside of the session itself (i.e., not basic syslogs that aren’t stored in a database)
- Traceable: All logged events should include a Trace ID, Correlation ID, or equivalent, which connects those logged events that occurred in the same session, but which spanned multiple servers. Without traceability, linked events can become detached, reducing your ability to audit, monitor, and analyze effectively and accurately.
- Verbose: Logs should include plentiful, detailed metadata that allows for detailed, multi-dimensional audits, and prevents dead-ends or blind spots due to logs being too basic, shallow, or information-poor.
- Aggregated: You should have the ability to aggregate logged data by any criteria, including session, user, server, tool, error type, event type, and more.
- Secure: Organizations should protect logs from unauthorized access, ideally within an MCP manager with credentialed access and role-based access controls. You shouldn’t store personally identifiable information (PII) or other sensitive data in logs.
Additional capabilities that are beneficial but not essential include:
- Exportable logs (as CSVs)
- Integrations with complementary systems (such as BI or SIEM tools)
- Logging custom events that are specific to your organization or use cases
Get more details on the information and characteristics your MCP logs need, and how you should use them, in our complete guide to MCP logging.
How To Generate Logs That Meet MCP Observability Requirements
MCP servers and clients do not come with the level of logging required for MCP observability. Generating the logs you require for MCP observability requires an intermediary later that intercepts your MCP messages and events, such as an MCP proxy/gateway like MCP Manager.
Platforms like MCP Manager include integrated MCP logging, reporting, dashboards, and alerts, providing you with comprehensive MCP observability.
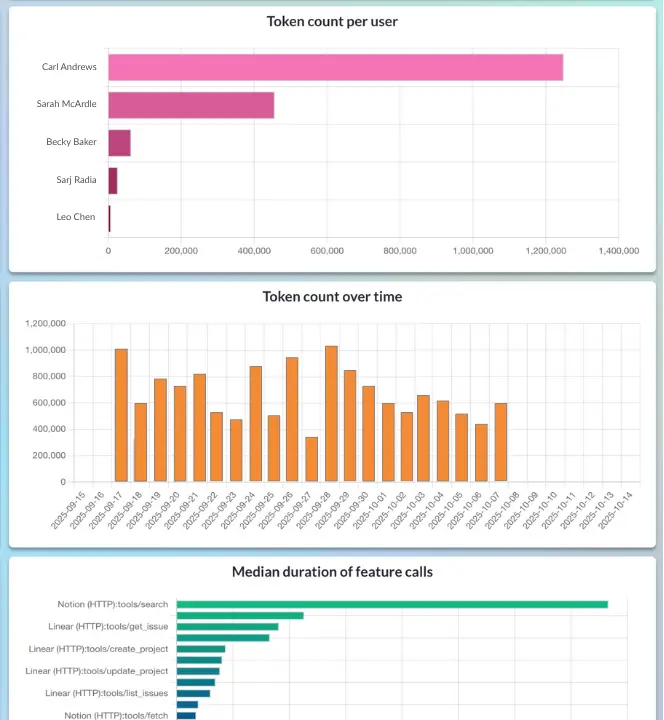
MCP Observability Component #2: Reporting
Reports, charts, and dashboards provide you with real-time, crucial, easy-to-digest insights into your MCP ecosystem’s health, security, and performance.
MCP Reports Within a Dashboard in MCP Manager:

Reports and dashboards present the data captured in your comprehensive MCP logs in a usable, visible format, enabling you to:
- Track performance and usage metrics over time
- Spot anomalies and spikes that could indicate issues with performance, connectivity, utilization, or security
- Understand how your teams are using MCP servers, and which servers, tools, and use cases are most popular and useful
- Understand and optimize different servers’, agents’, and users’ resource utilization
- Track, measure, and analyze any other aspect of MCP-based communication, usage, and performance that you need insights into
Here are some of the reports that MCP Manager customers most frequently use:
- Total number of active servers
- Total number of active gateways
- Total number of active apps and agents
- Total number of connections
- Feature calls per user
- Token count per user
- Feature calls over time
- Token count (token usage) over time
- 95th percentile duration of feature calls
- Median duration of feature calls
- Server popularity by user count
- Number (and error type) of error codes by MCP server
How To Get Comprehensive MCP Reports and Dashboards
Reports require data, so you will need MCP logs that fit the requirements in the section above (“MCP Observability Component #1: Logging”). Depending on the format in which your logs are generated and stored, it is possible to import them into existing visualization tools to create reports and dashboards.
For seamless, real-time dashboards that provide maximum accuracy and responsiveness, select MCP server management software such as MCP Manager, which has integrated logging, reporting, dashboards, and alerting.
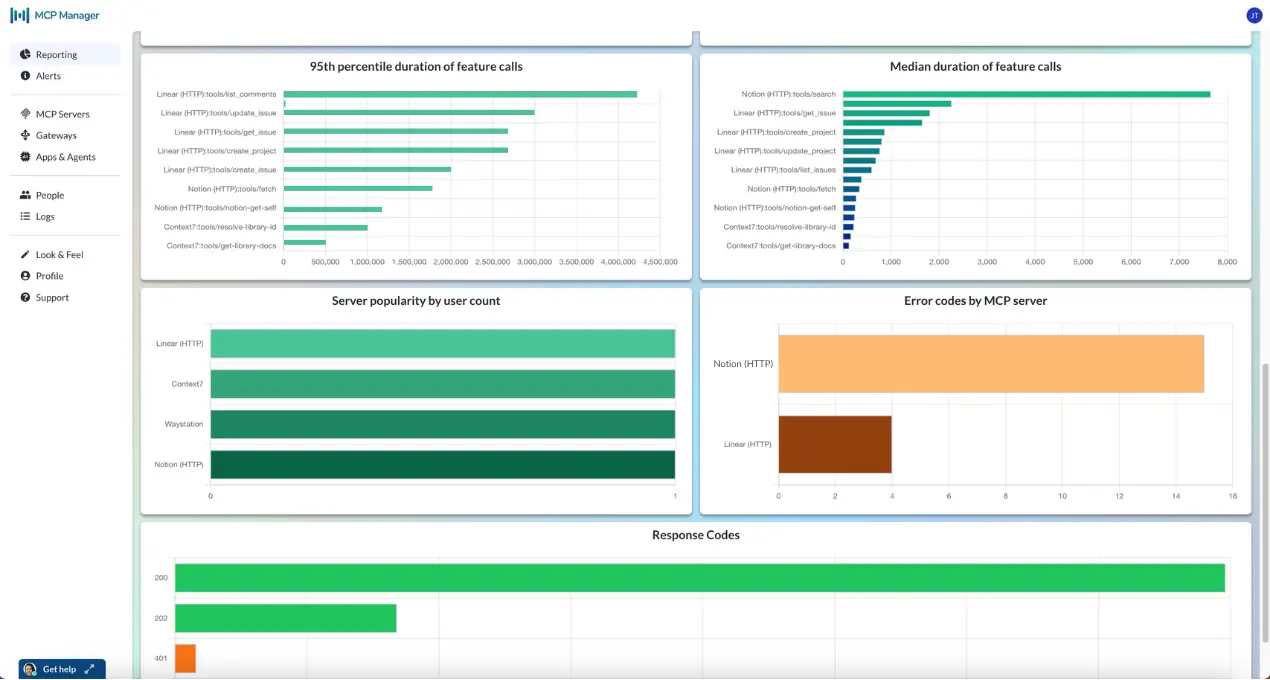
More MCP reports within my dashboard in MCP Manager:
MCP Observability Component #3: Alerting
Alerting is an essential component in MCP observability as it makes you and your relevant team members aware of information that is important to maintaining the health, performance, and security of your MCP ecosystem.
The Alerts Panel in MCP Manager:
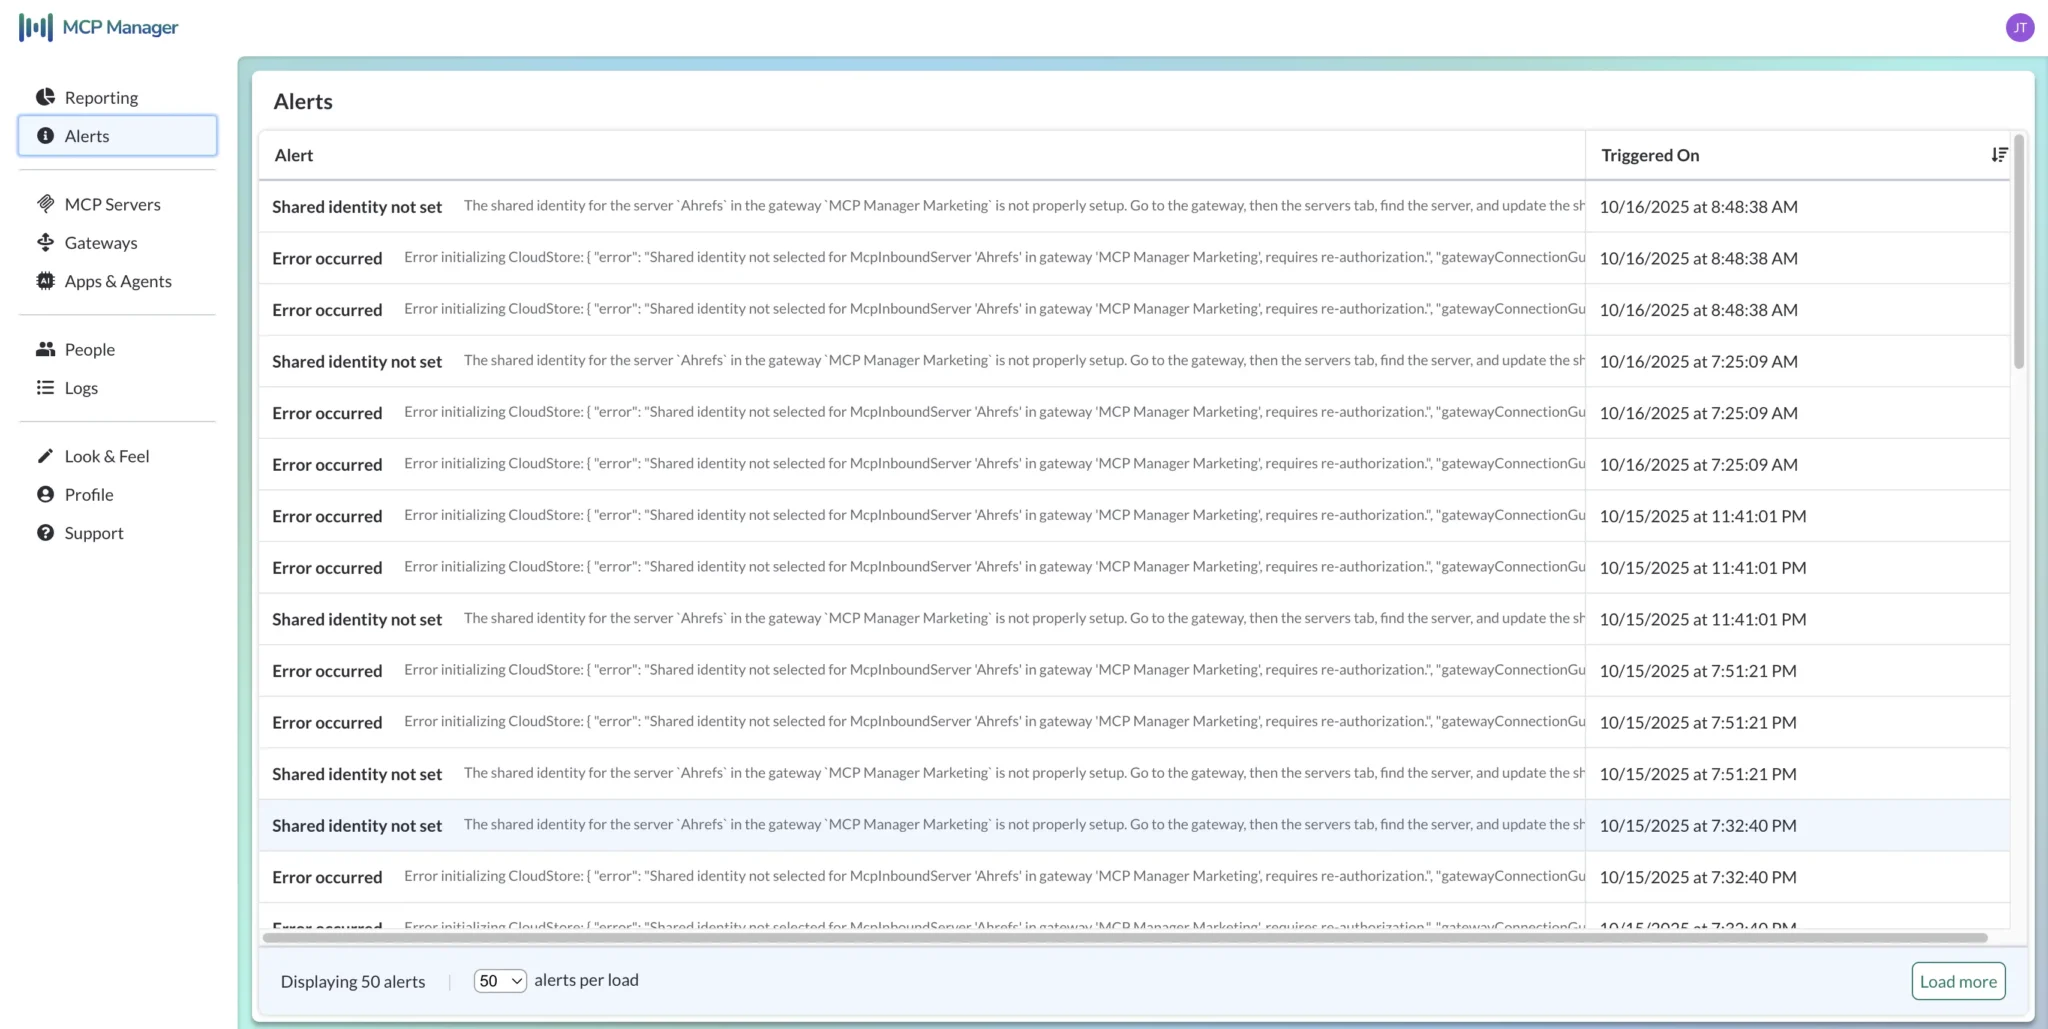
MCP alerts help teams detect issues faster and reduce your Mean Time to Resolution (MTTR). Although it’s possible to detect issues using reporting and analysis of logs, this is impractical.
Alerts bring your attention where it is needed, when it is needed, so that you can take action faster to keep your MCP and AI deployments running smoothly and securely.
How To Get MCP Alerting
Given the urgent nature of alerting, you will need to either select a platform that provides an MCP gateway with integrated logging and alerting (such as MCP Manager) or that can integrate with an observability platform.
Examples of MCP Reports
Here are some examples of MCP reports based on those that are most popular among MCP Manager customers and users:
- Total number of active servers
- Total number of active gateways
- Total number of active apps and agents
- Total number of connections
- Feature calls per user
- Token count per user
- Feature calls over time
- Token count (token usage) over time
- 95th percentile duration of feature calls
- Median duration of feature calls
- Server popularity by user count
- Number (and error type) of error codes by MCP server
You can see many of these reports in the images below, all of which are from MCP Manager’s dashboard/reporting module:
How to Get MCP Observability
In order to get observability over your MCP deployments, you need these three components:
- End-to-end, traceable, verbose logging of MCP communications and events
- Comprehensive, real-time reports and dashboards
- Integrated alerting for issues with connectivity, performance, and security
I won’t deep-dive into these components again as I’ve explored them extensively above.
The foundational element of MCP observability is an intermediary layer, such as an MCP proxy, which organizations typically deploy as part of an MCP gateway.
The MCP proxy/gateway mediates and moderates MCP communications between MCP clients and servers primarily for security purposes, to enforce security policies, control access to resources, sanitize prompts, and so on.
However, through that mediation, an MCP gateway is able to capture detailed logs of MCP communications and events, including custom events and event types.
Based on the captured data, the gateway generates detailed logs, populates real-time reports and dashboards, and fires off triggered alerts, providing enterprise-level observability for your MCP and AI ecosystem.
In short, if you want MCP observability, you need an MCP gateway. It’s worth noting that not all MCP gateways offer built-in observability features like logging, reporting, and alerting. MCP Manager does, but it is very much at the forefront of making MCPs ready for business use.
Conclusion
MCP observability is essential for business deployments of MCP servers. It provides teams with the information they need to maintain their MCP deployments’ health, performance, and security, and to analyze, improve, and demonstrate the positive impact of their AI and MCP deployment on their business.
MCP observability starts with logging, and logging starts with an intermediary proxy, usually provided as part of an MCP gateway. The MCP gateway provides you with the necessary data to support detailed, end-to-end logging, and real-time reporting and alerting.
However, not all MCP gateways are made equal. Different gateways have different levels of logging detail and traceability, and many do not have built-in reporting and alerting capabilities.
I would recommend that when you assess software to deploy, manage, and secure your MCP servers, you pay close attention to their monitoring and observability offering, too. If you do so, you will save yourself the pain of trying to achieve real-time observability by stitching together data from your MCP gateway with secondary observability or visualization tools.
Book your demo below to see how MCP Manager gives you a comprehensive solution for MCP deployment, observability, and security: